Insights
Insights give you a real-time view of your Keycloak deployment's performance, usage, and user activity. Cloud-IAM provides built-in dashboards that help you:
- Understand user behavior
- Monitor system health and request traffic
- Track login trends and user growth
- Detect anomalies like blocked IPs or error spikes
These analytics help you make faster, data-driven decisions and ensure your Keycloak environment stays secure and efficient.
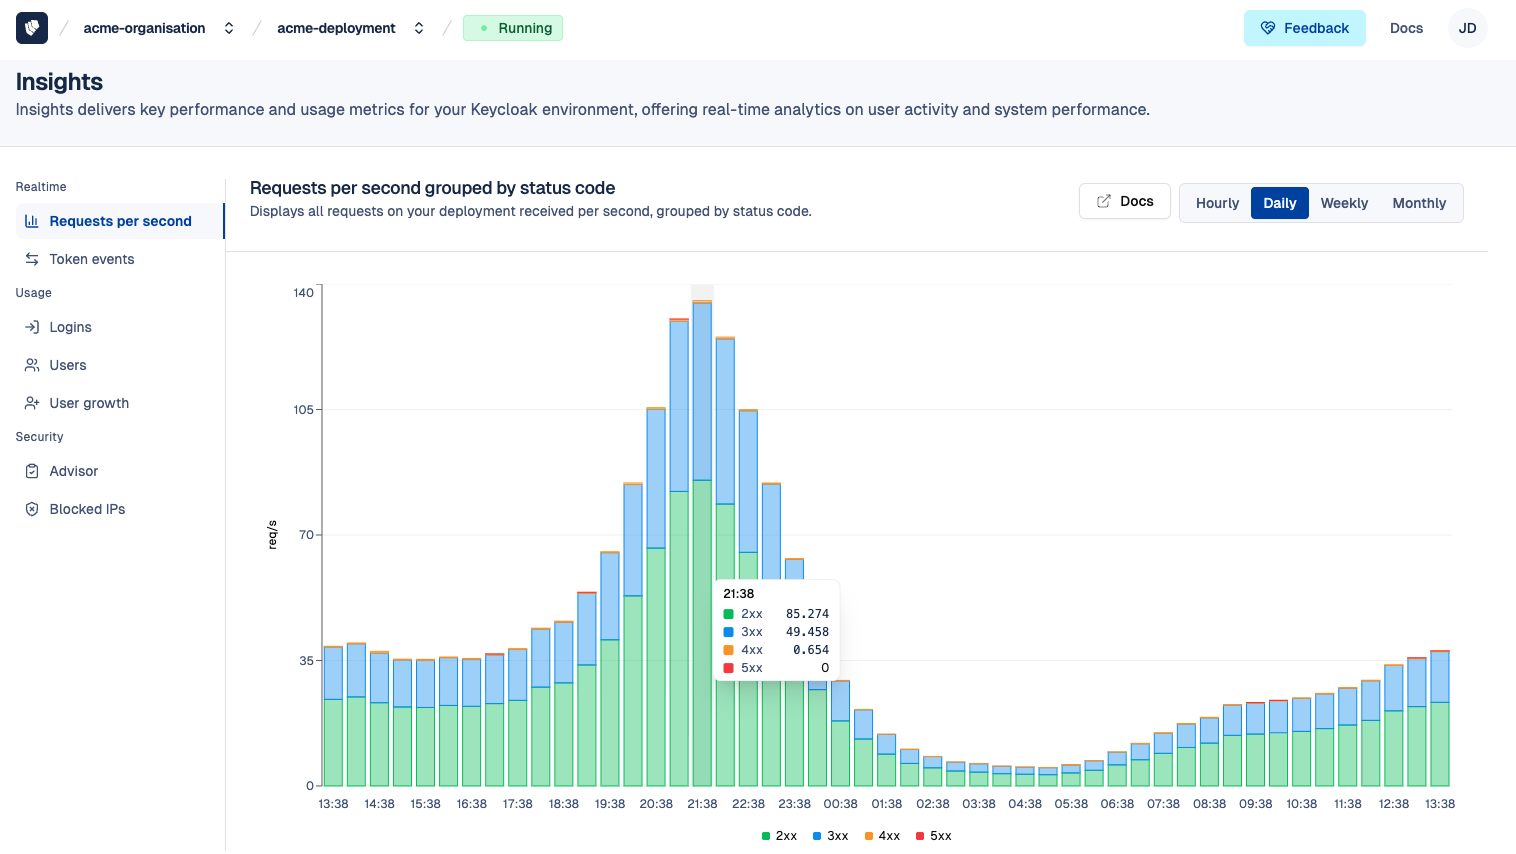
Requests per second
Track all incoming requests to your Keycloak deployment, grouped by HTTP status code (e.g., 2xx, 3xx, 4xx, 5xx). This graph helps you monitor traffic volume and identify anomalies or performance issues at a glance.
- Data is displayed in requests per second
- Status codes are color-coded for clarity
- You can adjust the time range: hour, day, week, or month
Use this insight to detect unusual spikes, assess load patterns, and ensure your infrastructure is responding correctly. insights-request-per-second-console
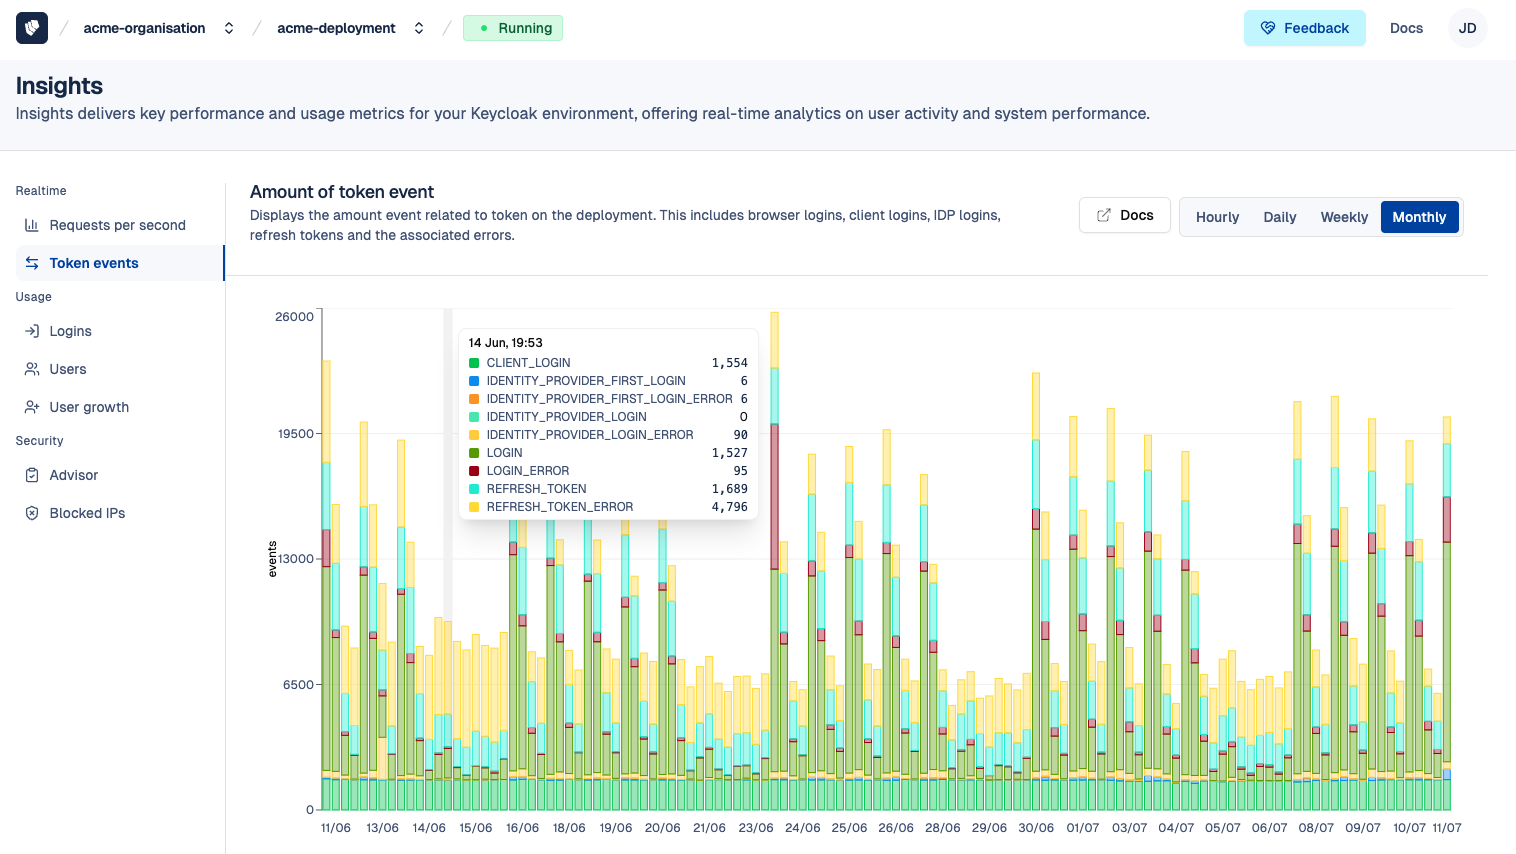
Token event
This graph shows the number of token-related events occurring on your Keycloak deployment. It helps you track authentication flows and detect unusual activity.
The graph includes the following token events:
- Client login
- Identity provider first login
- Identity provider first login error
- Identity provider login
- Identity provider login error
- Login
- Login error
- Refresh token
- Refresh token error
You can filter the data by hour, day, week, or month to adjust visibility based on your monitoring needs.
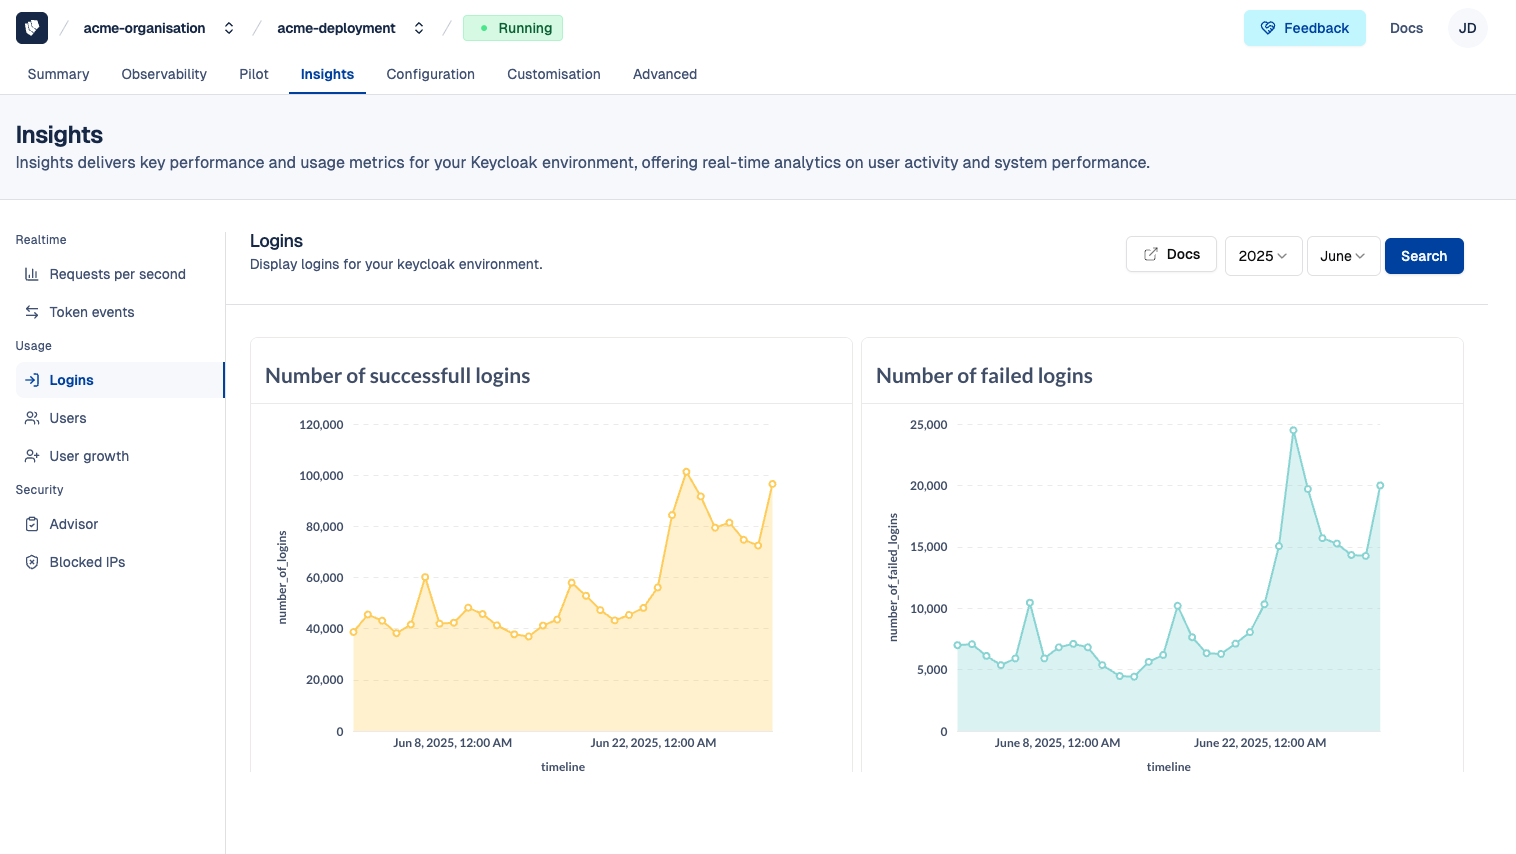
Logins
This section provides a clear view of login activity on your Keycloak environment.
It includes two distinct graphs:
- Successful Logins – Displays the total number of users who successfully authenticated.
- Failed Logins – Shows the number of unsuccessful login attempts.
You can filter both graphs by month and year to monitor trends over time.
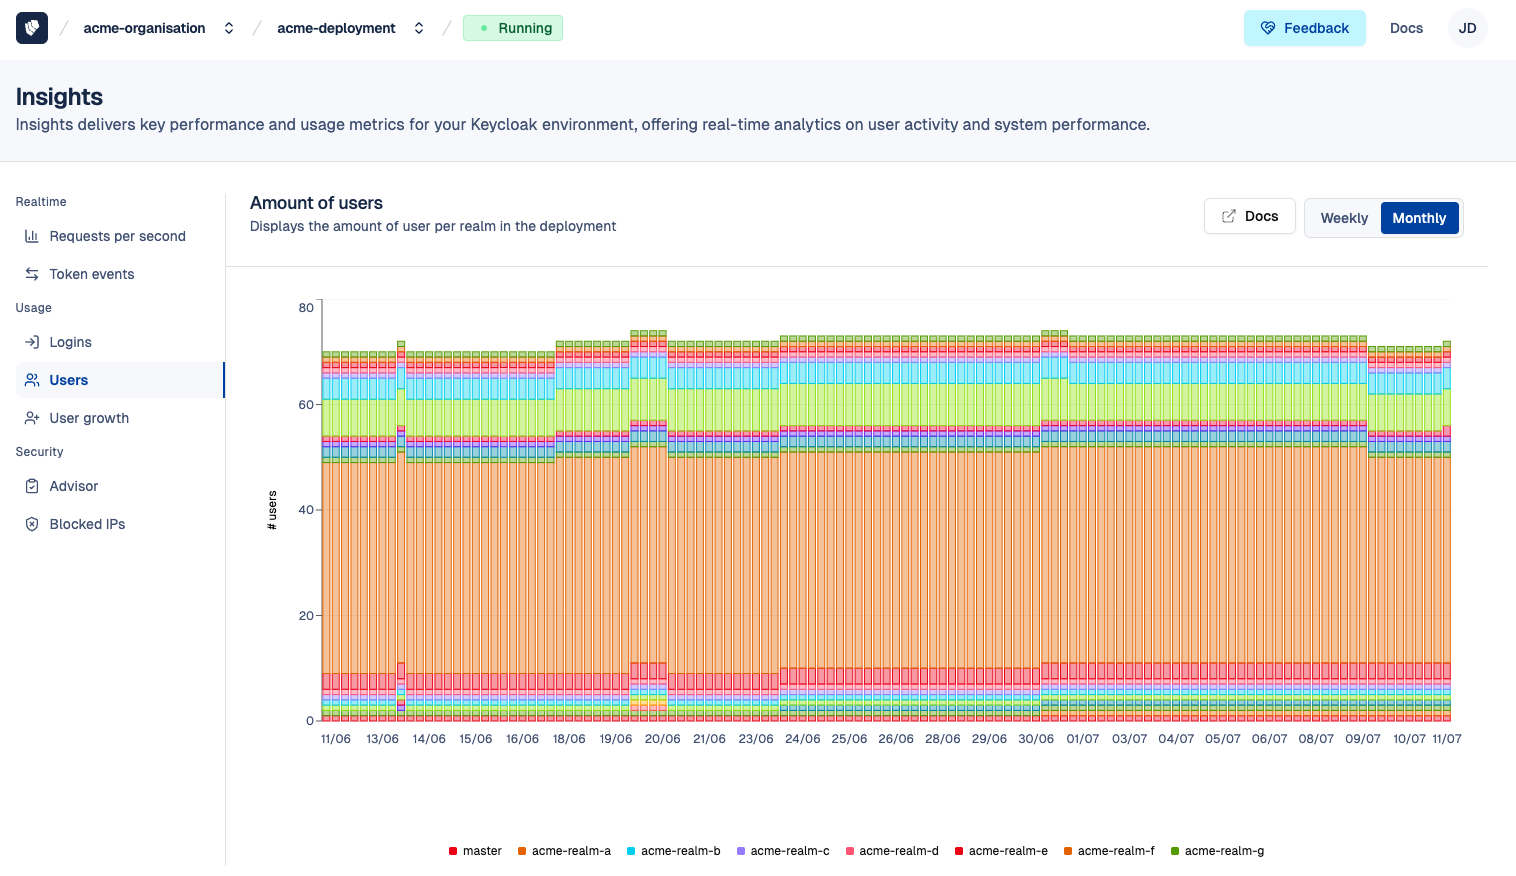
Users
This graph shows the total number of users across your Keycloak deployment, segmented by realm. It provides a clear snapshot of user distribution and growth per realm, helping you monitor usage.
You can adjust the view by week or month to observe long-term trends and changes in user base.
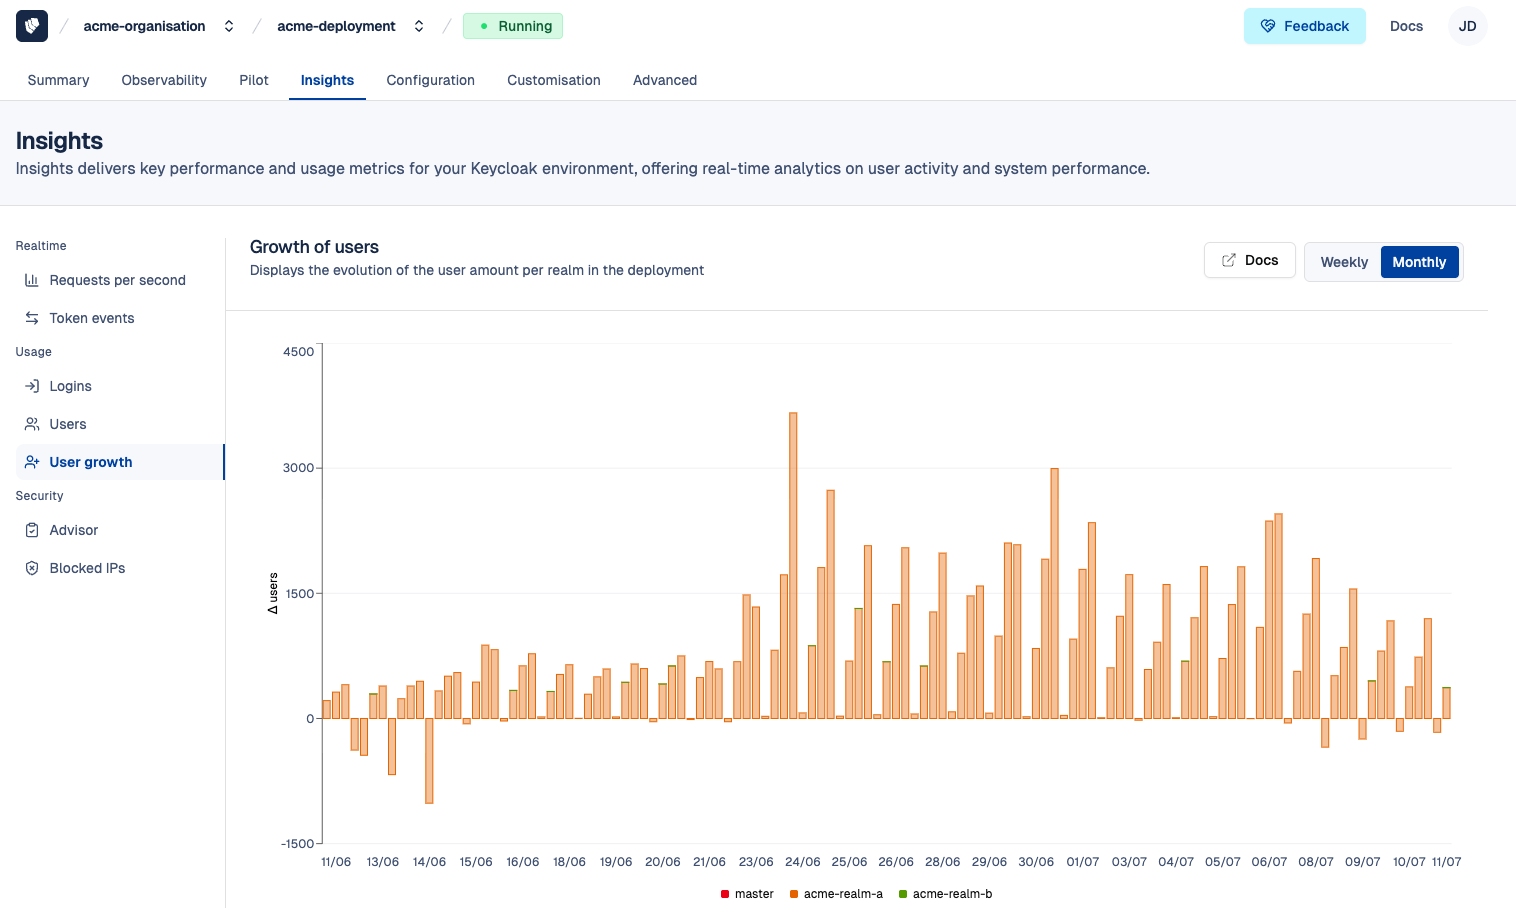
User Growth
This graph displays the evolution of the user count over time, segmented by realm. It helps you track how your user base is growing across different parts of your Keycloak deployment.
Customers can view user growth delta data by week or month, allowing for flexible trend analysis, making it easy to identify spikes, declines, or consistent trends in user registrations.
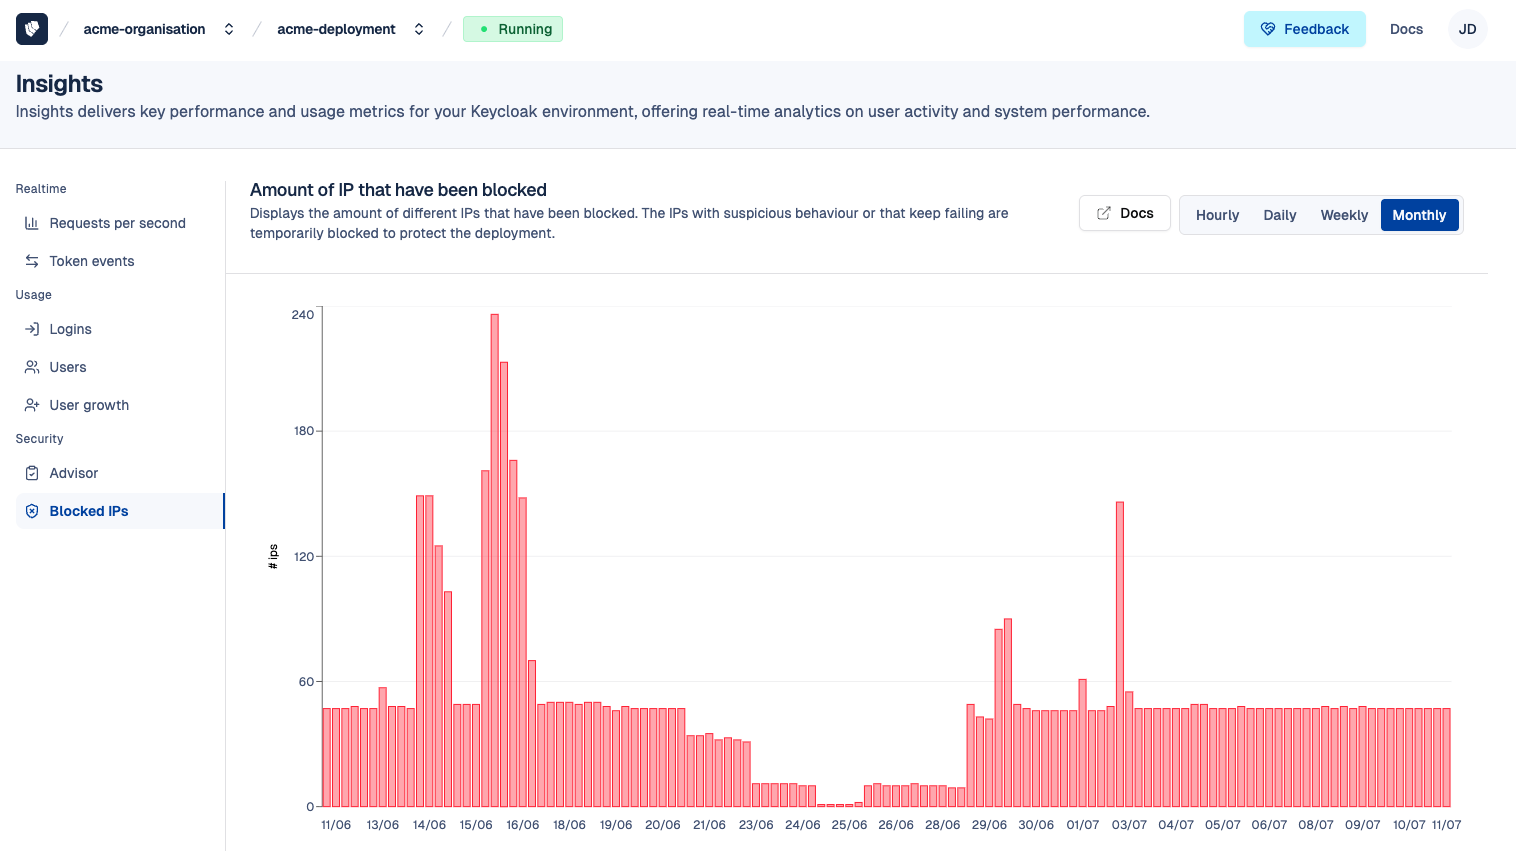
Blocked IPs
This graph displays the number of unique IP addresses that have been temporarily blocked due to suspicious behavior or repeated failed access attempts. Blocking is part of Cloud-IAM's automated security measures to protect your Keycloak deployment from abuse and brute-force attacks.
Customers can customize the graph view by hour, day, week, or month to analyze patterns and trends over time.