Access Logs
How Cloud-IAM ensures monitoring
To ensure your Keycloak deployment runs properly, Cloud-IAM has implemented:
- Continuous monitoring
- Log collection at different system levels
This setup gives you complete visibility into your deployment's health and activities. All logs are securely stored on Cloud-IAM infrastructure for 30 days.
What do Access Logs contain?
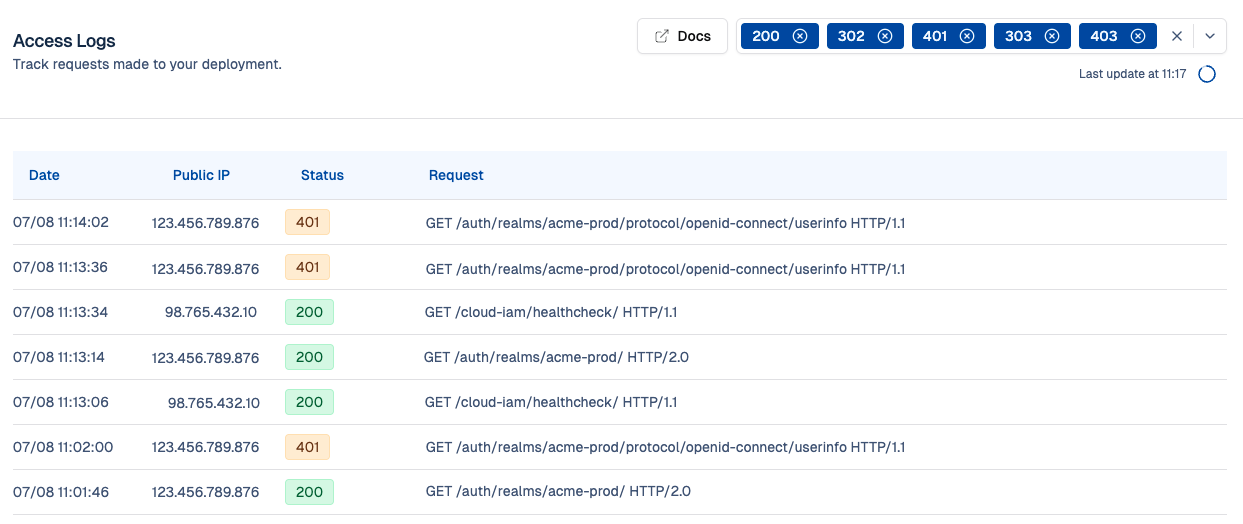
Access Logs are collected from the load balancer in front of your Keycloak deployment. They capture all incoming HTTP requests and include key information such as:
Date— Timestamp of the requestPublic IP— IP address of the client making the requestStatus Code— Response status (e.g.,200,302,303,400,401,403, etc.)Request Method— HTTP method used (e.g.,GET,POST, etc.)
This data helps you understand how users or systems are accessing your Keycloak deployment, and whether any issues occurred during requests.
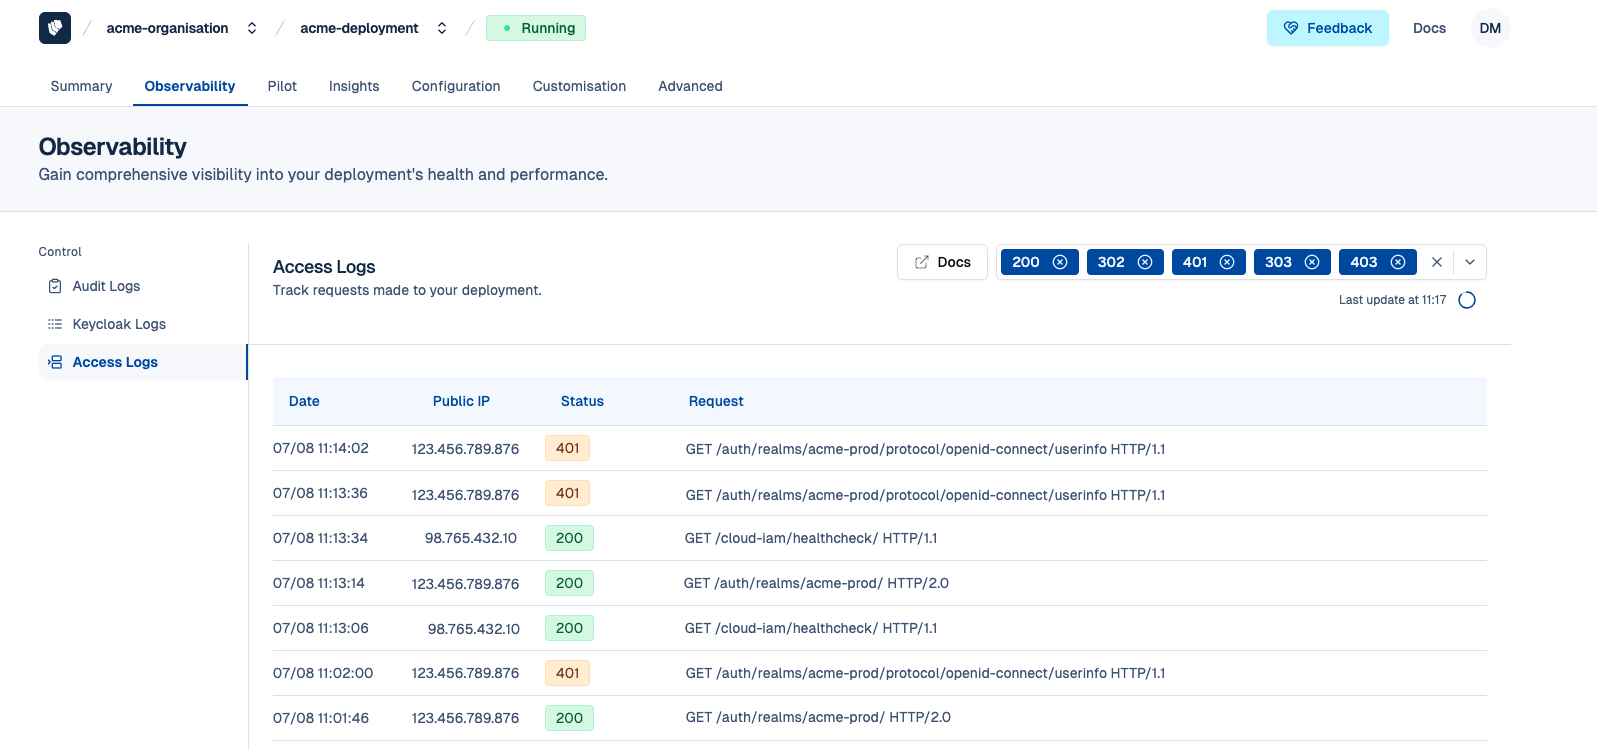
How to view Access Logs
Follow these easy steps to find your Keycloak Logs:
- Open Cloud-IAM console
- Select the Keycloak deployment you want to audit.
- Click on
Observability - Then select
Access Logs
You will now see all the access logs related to your deployment.
Access Logs ingestion
API description
The API for fetching the logs needs to be polled. The API will return in the response body, an array of lines composed of a timestamp and its message:
[
  "2023-03-07T10:00:05.85104771Z 2023-03-07 10:00:05,850 WARN  [org.keycloak.authentication.DefaultAuthenticationFlow] (executor-thread-727) REQUIRED and ALTERNATIVE elements at same level! Those alternative executions will be ignored: [auth-cookie, auth-cookie]\n",
  ...
]
The response come with HTTP headers that will drive the next polling url and delay.
x-stream-polling-url: the url to call to fetch the next batch of logs. It will contain an additionalsinceparameter to continue just after the last log line that was returned.x-stream-polling-delay: the delay in seconds to wait before polling the next batch of logs.x-stream-has-more: an optional header that indicates that additional log lines are already available and can be fetched without waiting. If set,x-stream-polling-delayvalue will be 0.
Delay on logs availability
For various performance reasons, the logs are buffered at several layers. It can be in Keycloak or in the load balancer memory, on disk, on our log ingestion pipeline or in the replication process across our nodes.
For this reason, we usually see a delay of a few minutes between the logs generation and its availability through the Logging API.
Load balancer description
Load balancer cluster logs can be integrated into customer's own logging infrastructure when polling Cloud-IAM REST API /deployments/{deploymentId}/logs endpoint with the source field to load-balancer.
$ curl -H "Authorization: Bearer $TOKEN" 'https://api.cloud-iam.com/deployments/00000000-0000-0000-0000-000000000000/logs?source=load-balancer&since=2023-02-26T23:17:06Z' | jq .
[
  "2023-03-07T10:00:05.85104771Z 1.2.3.4 - - [07/Mar/2023:10:00:05 +0000] \"GET / HTTP/1.0\" 403 0.000 548 \"Mozilla/5.0 (Linux; Android 9; Nokia 7.1) AppleWebKit/537.36 (KHTML, like Gecko) Chrome/72.0.3626.121 Mobile Safari/537.36\" \"-\" \"-\" \"-\" \"-\" \"h:-\"",
  ...
]
Fetch with filebeat for Elasticsearch
Filebeat is a lightweight shipper for forwarding and centralizing log data maintained by the Elasticsearch community. It can be used in combination of Logstash to collect / transform / parse and inject logs in your log infrastructure.
Here is a snippet of a filebeat input configuration to fetch the logs from the Cloud-IAM API. You will need to adjust the output section accordingly to your log infrastructure settings.
Make sure to replace the values for {service-account}, {service-account-password} and {deployment-id}. Adjust the source parameter line 8.
filebeat.inputs:
- type: cel
  enabled: true
  auth.oauth2.client.id: {service-account}
  auth.oauth2.client.secret: {service-account-password}
  auth.oauth2.token_url: https://iam.cloud-iam.com/auth/realms/cloud-iam/protocol/openid-connect/token
  interval: 60s
  resource.url: https://api.cloud-iam.com/deployments/{deployment-id}/logs?source=keycloak
  program: |
    get(state.url)
    .as(request,
      {
        "events": request.Body.decode_json().map(e,
            {
              "@timestamp": string(e).split_n(" ", 2)[0],
              "message": string(e).split_n(" ", 2)[1]
            }),
        "want_more": request.Header.exists(e, e == 'X-Stream-Has-More'),
        "url": request.Header['X-Stream-Polling-Url'][0]
      }
    )

output.file:
  enabled: false
  path: "/tmp/"
  filename: cloud-iam-keycloak.log
  permissions: 0640
  codec.format:
    string: '%{[message]}'

output.elasticsearch:
  enabled: false
  hosts: ["http://localhost:9200"]
  api_key: "xxxxxxx:yyyyyyy"
index: "cloud-iam-keycloak-%{+yyyy.MM.dd}"For testing purpose, you can use this configuration file in a docker container:
$ docker run --rm -it -v $PWD/filebeat.yml:/usr/share/filebeat/filebeat.yml \
                      -v $PWD/output:/tmp \
                      docker.elastic.co/beats/filebeat:8.17.4